For the S&P 500 Index, the Weighting Is the Hardest Part (to Keep the Bubble Going)

The late, great rocker Tom Petty said it best: “you take it on faith, you take it to the heart, the waiting is the hardest part.”
What are many investors waiting for these days? An opportunity to buy not just a dip, but a BIG dip. A dip that is more than just another knee-jerk reaction.
It hasn’t happened yet, and it might not happen anytime soon. But like the laws of gravity, the market is ultimately cyclical. And that means that all good bubbles must pop.
Investors are looking for that dip in what they refer to as “the stock market,” also known as the S&P 500 Index ($SPX), weighted by market capitalization.
However, a lesser-known version of that same set of stocks, weighted equally instead of by company size, is to me a more indicative sign of U.S. large-cap stock market health.
You’re Only as Good as Your Weakest Link. Except with the S&P 500.
Let’s examine this through a comparison of the Invesco Equal Weight S&P 500 ETF (RSP) and Invesco S&P 500 ETF (SPY), the original ETF that debuted in 1993, and tracks the more popular cap-weighted version of the index. Spoiler alert: SPY is way ahead of RSP. It’s a historically high rate of outperformance in fact. As a reminder, this is the same 500 stocks, but the biggies at the top are getting further away from the rest every day.
For traders who have been hoping for broader participation in this rally, the “waiting” is the hardest part. Along with the “weighting.”
I ran a set of statistics to show just how great that RSP lag has been. That includes not only past performance versus SPY, but assets under management and trading volume. Volume-wise, here are the prices and average share volume. When we multiply them together for each ETF, SPY trades over $40 billion worth of shares a day. RSP checks in at under $3 billion. Some of this is due to SPY having a much more robust options market than RSP. But allow me to remind you: same stocks, different weighting.
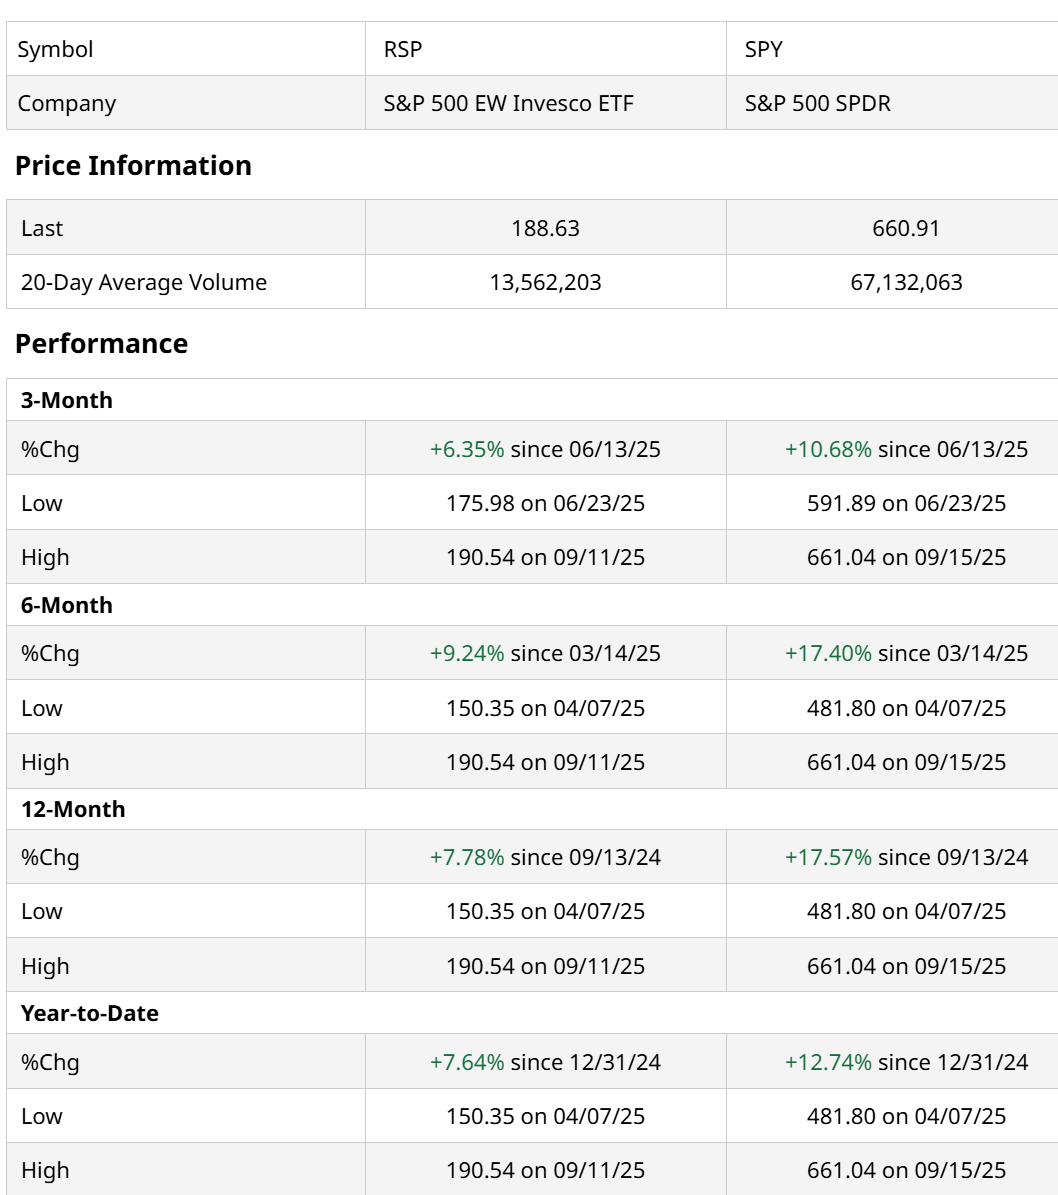
That chart above also shows just how much SPY has been pulling away from RSP, just in the past 6 months. That nearly 8% advantage (or nearly double the return for SPY versus RSP) is the type of thing that is a staple of stock market bubbles. But it doesn’t tell us it is over, just that we’re in some very undiversified times among the biggest U.S. stocks.
Longer-term performance of the pair (RSP still on the left, SPY on the right below) shows that in particular, the past 3 years have been an old-fashioned rout for SPY. Nearly a 2-to-1 advantage in terms of return. RSP’s trailing price-earnings ratio is about 10% below that of SPY. But does anyone care about that? Not currently.
The only time in modern stock market history where this type of divergence continued for this long was the dot-com bubble, before RSP was even a listed ETF. But using the indexes themselves, I discovered that from the start of 1995 through the end of March 2000, the S&P 500 cap-weighted index had a 226% to 125% advantage over the S&P 500 equal-weighted index.
Traders: Don’t Sit on Your Big Lead, Pay Attention to History
What happened next, starting in April 2000? Over the next 12 months, when the bubble burst and the top-heavy index came tumbling down by more than 22%, the index RSP is based on was UP 3%. A 25% turnaround. Sort of like what happens frequently during the second half of NBA games.
What’s the takeaway here? That it is highly likely we will see a “reversion to the mean,” since RSP does not typically lag SPY like this indefinitely. But to add to the SPY-favored side of this, when I glance at the daily charts of both ETFs, I see this for SPY and RSP.
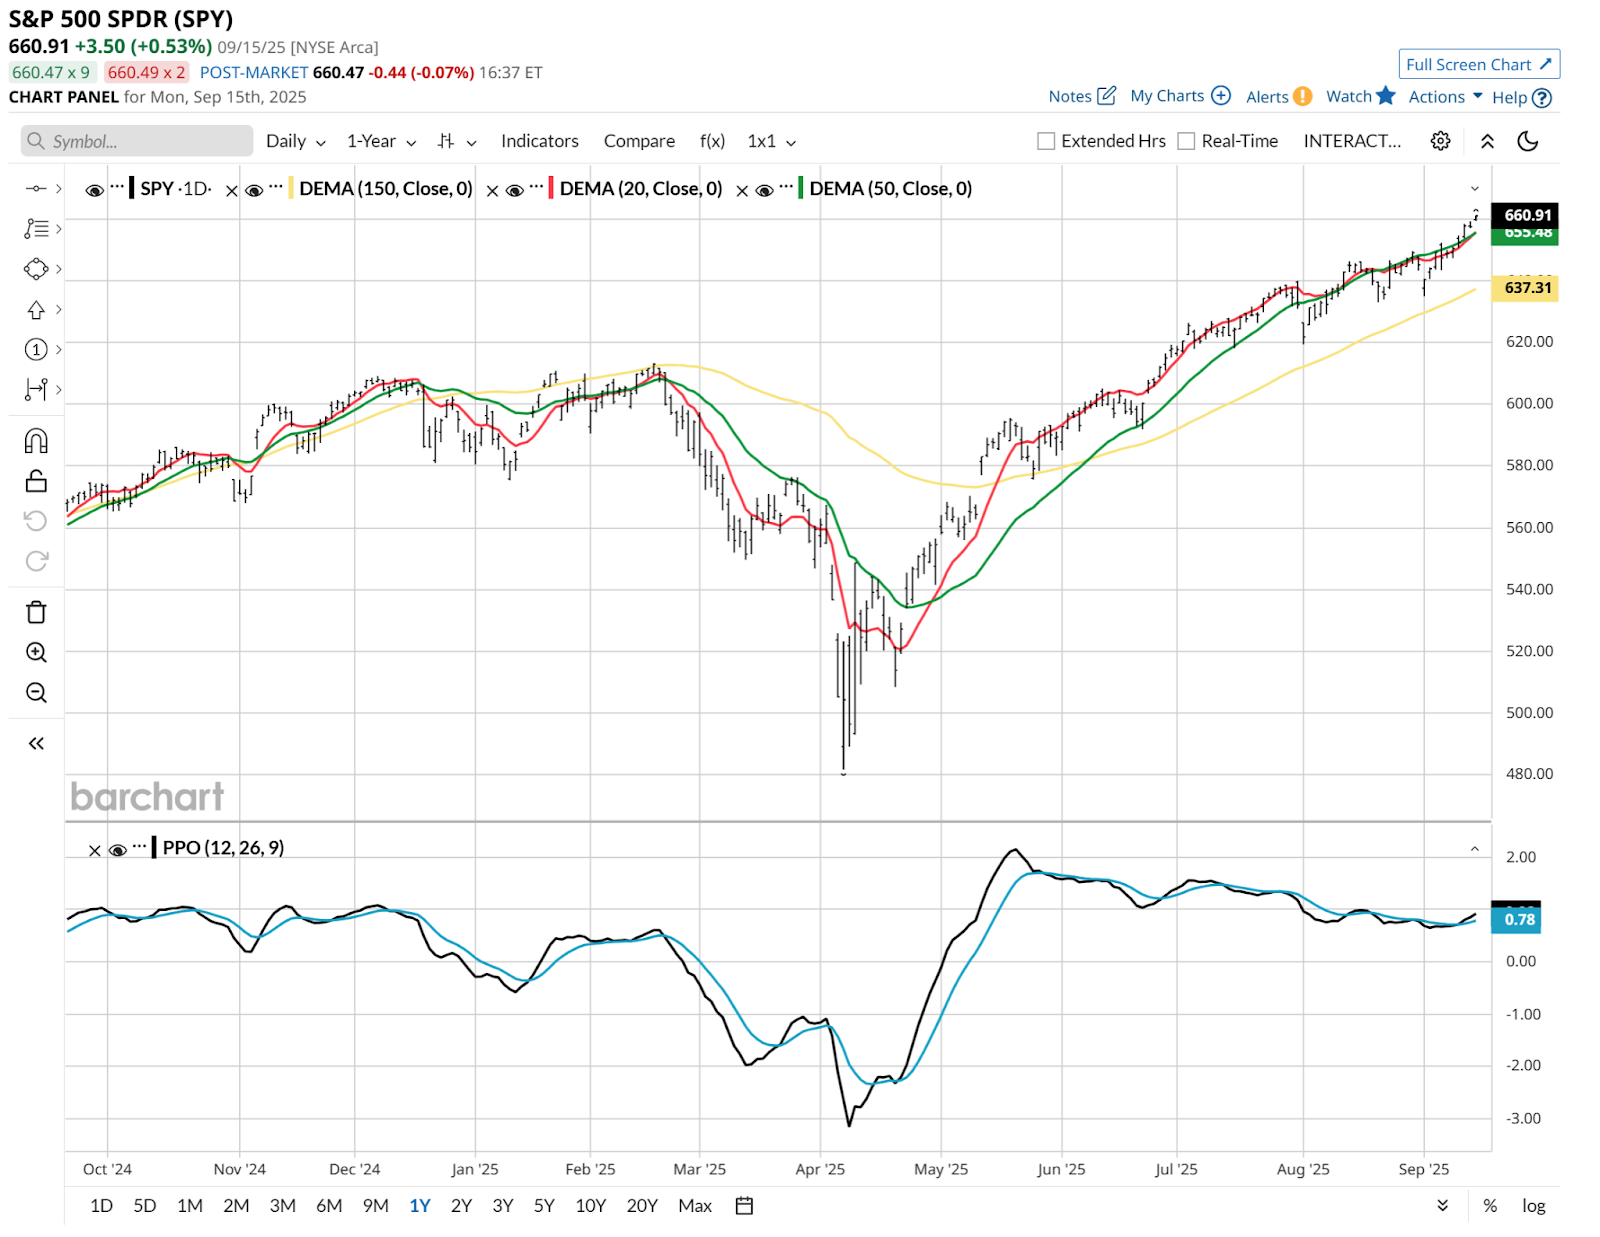
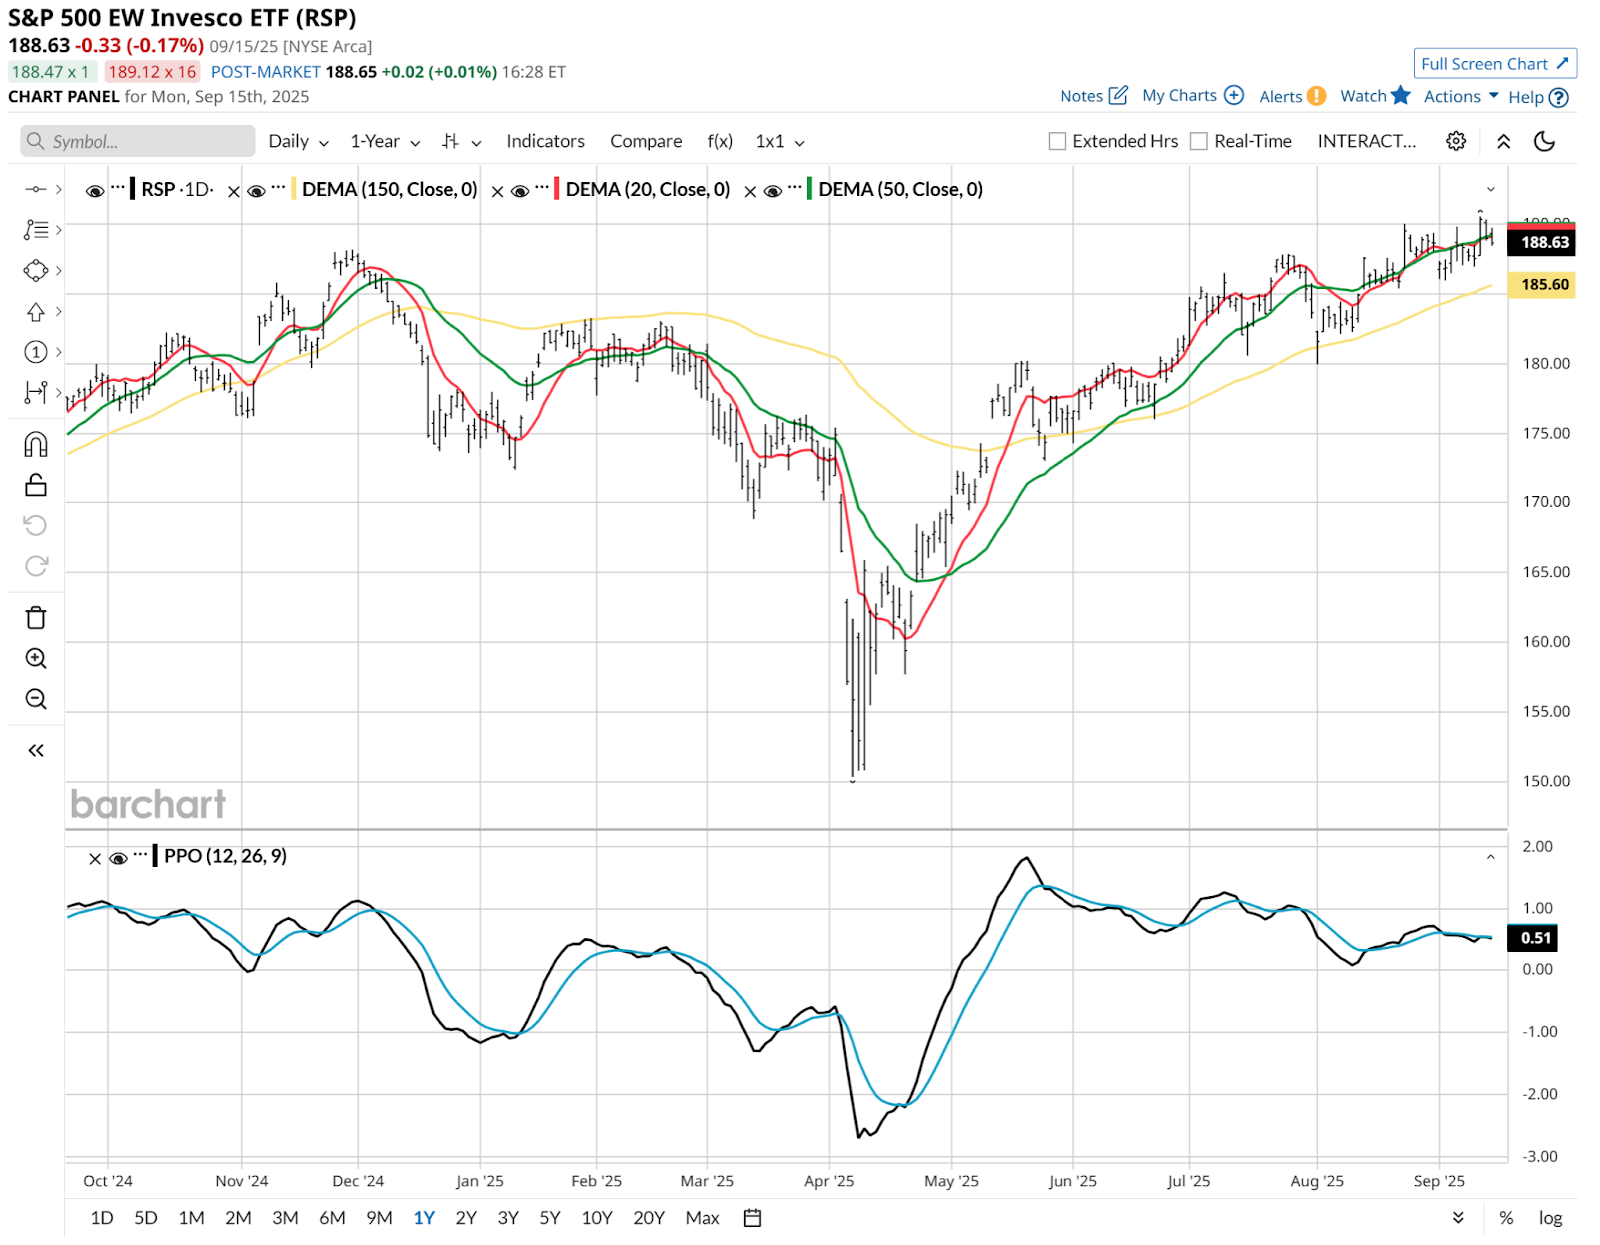
Do you see what I see? At the tail end of the chart’s upper section, SPY is actually now trying to break out yet again. RSP has a much flatter appearance.
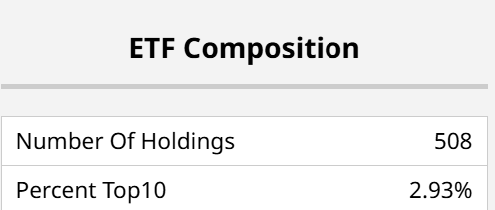
Translation: It would not surprise me at all to see SPY continue to stretch its lead versus RSP for a bit longer. It has everything to do with the fact that SPY has 38% of its assets in only 10 stocks.
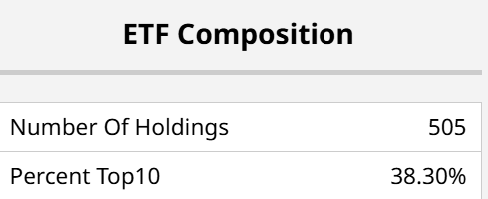
How does that compare for RSP? Less than 3%. Essentially the same names, but in completely different position sizes.
Waiting for the Weighting in the S&P 500
When it eventually turns, I think it will be more like a rush to the exits than a gradual recognition. This age of algorithmic trading has a way of speeding things up like pitocin provided to an expectant mom. Stay tuned, and be mindful of history. Because right now, the waiting, because of the weighting, is the hardest part.
On the date of publication, Rob Isbitts did not have (either directly or indirectly) positions in any of the securities mentioned in this article. All information and data in this article is solely for informational purposes. For more information please view the Barchart Disclosure Policy here.